Working With Variables
On this page, “working with variables” refers to “working with columns” of a loaded file with variables in the Project.
The ANTAVIRA platform provides the following functionality for working with variables:
- Formation of a variable list;
- Processing of variable values;
- Measurement of variable correlation.
Formation of a variable list
If you need to limit/filter the variables for modeling according to some conditions, you can use:
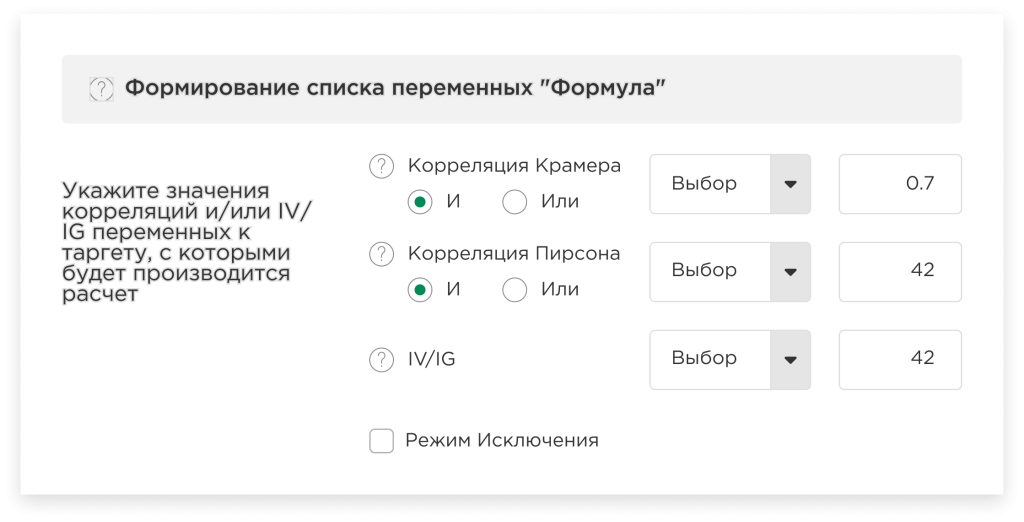
Formation of the list of variables “Formula”:
In this case, you need to specify the values of correlations (Cramer and/or Pearson) and/or IV/IG of variables in relation to the value of the targets with which the calculation will be performed, so that the platform can clean up variables that correlate poorly with the target. Then only those variables that correspond to the given formula will participate in the modeling process. In other words, the platform will filter the columns of the entire dataset according to the condition you specify.
Formation of the list of variables “List” (in developing):
In this case, on the contrary, you need to load a CVS file with the variable names (columns) to be used and specify the row separator. Then only those variables (columns), that correspond to the loaded list, will participate in the modeling process.

If the conditions are not set, then the modeling process will be carried out for all variables.
Processing of variable values
ANTAVIRA allows you to process variable values in 5 different ways:
Grouping:
In order to structure data, discover complex relationships between variables, and efficiently build machine learning models, the platform provides an innovative approach to solving the problem of grouping variables, which has no analogues on the market. The grouping module allows you to process the values of variables in such a way that, by combining the values of the variables into a set of groups and replacing the values of the variables with the group number, it maximizes the predictive power of this variable, in other words, increases the correlation of the variable to the target.
Flexible configuration of this module allows you to:
- Create several sets of settings with different parameters for “Grid search” analysis for grouping:
You can experiment with different sets of settings for “Grid search” analysis to find the best way to group variables.
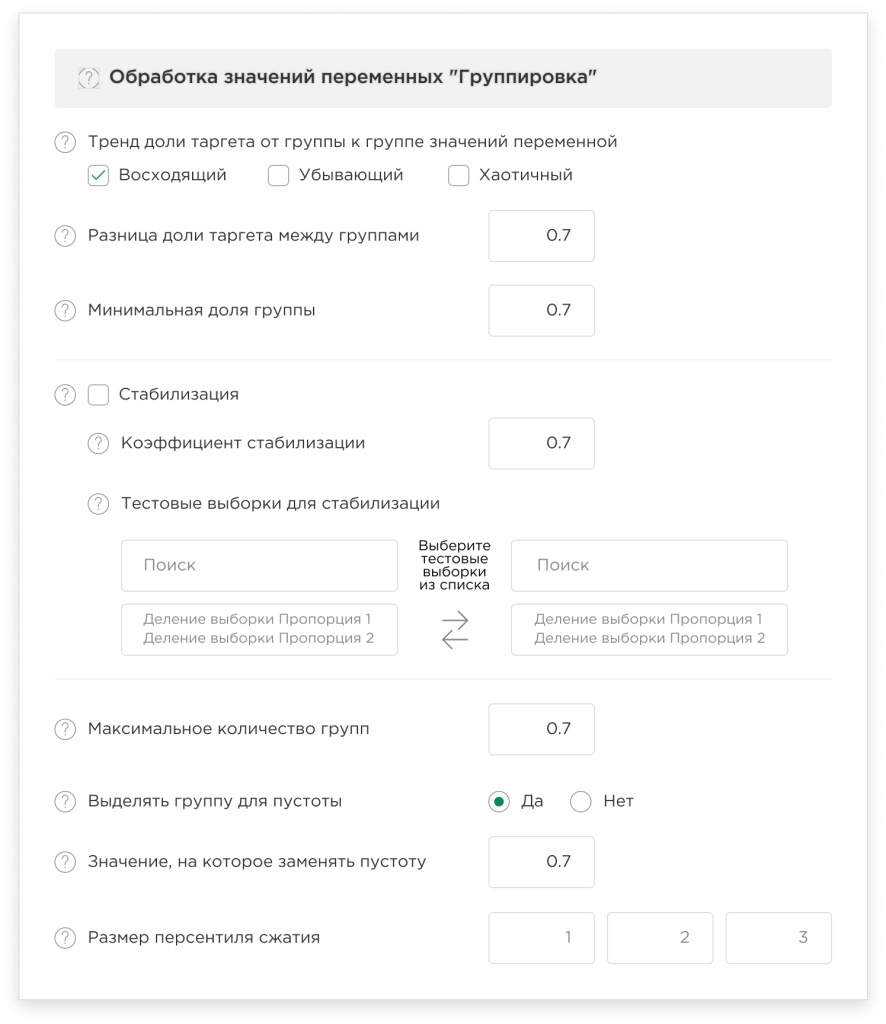
The configurable options are:- Trend of target proportion from group to group of variable values (ascending, decreasing, chaotic). In this case, after grouping, the platform will leave only those variables that obey the selected trends.
- Difference in target proportion between groups. This is the minimum value by which, in your opinion, the proportion of the target of neighboring groups should differ. The greater the difference between the proportions of targets of neighboring groups, the higher the predictive power.
- Minimum group proportion. This is the minimum size of observations with targets that is included in the group. We recommend choosing the minimum proportion in such a way that the number of observations, that fall into the minimum group, is a statistically significant number (we consider a statistically significant number to be either at least 5% of the dataset and at least 150 observations).
- Stabilization. This is our own development, which allows you to select stable variables both on the training and test sets. That is, the proportion of groups and the values of the proportion of targets will correspond on the test and training sets according to the specified coefficient.
For example, a stabilization factor of 0.75; variable v1; group 1; training sample – group proportion 20%; target proportion 60%; accordingly, the allowable values on the test set for this group are the proportion of the group 15-25%; and the proportion of the target is 45-75%. In other words, the deviation from the values of the proportion of the group and of the proportion of the target from the training sample to the test set should be no more than 25%. That is, this function allows you to select variables that work the same on the training and test sets.
The platform also allows you to select one or more test sets (in case you ran the splitter several times) for stabilization. If you have selected several test sets, then the stabilization coefficient condition must be met on all selected sets.
- Set the number of groups: You can set the maximum number of groups that the grouping module should divide your dataset into. Please note that the more groups you specify, the longer the count takes, and the number of groups cannot exceed the number of variables.
- Configure missing value handling in your dataset:
In order to avoid errors and distortions due to missing value during the model training process, you can select a group for the missing values to exclude the use of missing values during the grouping process, and you also need to enter a value to replace the missing values with.
If you have already replaced the missing values with some value yourself, specify this value.
- Configure compression percentile size:
This function is a preliminary data smoothing procedure to speed up the modeling process.
It is adjusted in percentages. Please note that the lower the percentage you set, the more detailed the grouping will be and the longer it will take.
Clustering (in developing):
In order to combine observations based on their similar characteristics/variables and the relationship between them, the platform also implements clustering.
When setting up this method, you can independently specify the number of clusters you need. Please note that the more clusters you specify, the longer the count takes, and the number of clusters cannot exceed the number of variables.

Binning (in developing):
You can use binning to reduce the impact of noise and to process the outliers, and also to reduce model complexity by simplifying data representation. When this method is executed, the values of the variables are divided into ranges called “bins”.
Thus, when working in the platform, you need to set the bin size as a percentage of the training set of your project.

Standardization (in developing):
Represents the simplest method of processing the values of variables in the platform during preparation and preprocessing for building machine learning models. Performed in order to transform the values of variables in such a way as to ensure their comparability in the context of modeling.
This method is not subject to flexible user configuration. When you select it in the graph, the platform will automatically take the necessary actions to perform the standardization of variables.
Normalization (in developing):
Represents the simplest method of processing the values of variables in the platform during preparation and preprocessing for building machine learning models. It is performed in order to scale the values of variables within a certain range and ensure their comparability in the context of modeling.
This method is not subject to flexible customization by the user. When you select it in the graph, the platform will automatically take the necessary actions to perform the normalization of variables.
Measurement of variable correlation
To optimize the model by excluding highly correlated variables, which, as a result, reduces the data dimensionality and improves the performance of the model, the platform implements the functionality of measuring the correlation coefficient between variables.
The method of correlation depends on the selected variable processing technique. Thus, you can use:
Cramer’s correlation
(in case of choosing grouping, clustering or binning);
Pearson’s correlation – in developing
(in case of choosing normalization or standardization).
In addition, if necessary, you can personally adjust the correlation value, above which variables can be deleted.