Key Features
Check out key features of the AutoML platform. ANTAVIRA will help in solving a wide range of tasks that require processing big datasets, the implementation of advanced analytics and the use of machine learning algorithms.
AutoML
Automated machine learning concept
The ANTAVIRA platform automates the process of predictive modeling by combining all the stages of modeling for a variety of targets into a single chain and setting them up with the help of a “single window”. At the same time, the created technology makes it possible to simultaneously run an unlimited number of counts with the same or different settings for the desired number of targets without sample size restrictions.
Thus, our concept of the AutoML is built on the automation of manual routine work and includes the following components:
- Creation of a project;
- Creation of a count, including the choice of targets and setting up the modeling graph;
- Setting up each function, included in the graph at the previous step, in the context of each stage of the modeling process and launching processes on the selected set of settings for the specified targets simultaneously;
- Automated modeling performed by the platform in the cloud based on the settings previously selected by the user for all the specified targets, taking into account the specified variables;
- Control panel for calculation results.
* Target is the desired variable for which the modeling process is carried out.
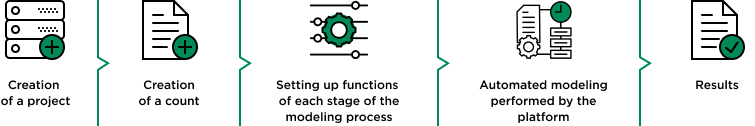
Figure 1: AutoML concept
Creation of a project
A project is a workspace that includes a sample with variables and a sample with targets in which modeling counts will be carried out. In the context of one project, you can run as many modeling processes as you like for the targets you need, united by one set of settings into a count.
We do not limit the number of projects you create; restrictions are imposed only by your financial capabilities. Data storage is subject to charges.
Accordingly, to work in the platform, you need to create a dataset file with variables and a dataset file with targets in the cvs format with column separators convenient for you.
If the datasets files are large, it is possible to transfer the data in a zip archive.
Variable values can only be numeric or string. Target values can be binary (0 or 1). Over time, it is planned to expand the ability to use targets with other numeric values.
Creation of a count
Each project consists of counts which represent a set of modeling processes for selected targets with one set of settings. You can create any number of counts, their number is limited only by your financial capabilities.
When creating a new count, the platform allows you to:
- Select the targets that can be chosen from the list or enter them as a comma-separated or newline-separated list. Please note that if no targets are specified, the modeling processes will be launched for all project targets.
- Configure the modeling graph for a count, which represents the sequence of executing functions for each modeling stage. Accordingly, you can create a unique graph of modeling processes for each count by selecting the stage functions in the desired sequence or use a predefined template that can be edited according to your needs.
In this case, the output of each previous function becomes the input for each next function. At the same time, the platform functionality allows you to execute the entire chain of the modeling process or its individual fumctions. For example, you can run only the data splitter or the variable grouper function. Additionally, any function except for modeling can be executed multiple times.
The graph can end with any function, but after the modeling function, no other function can be added.
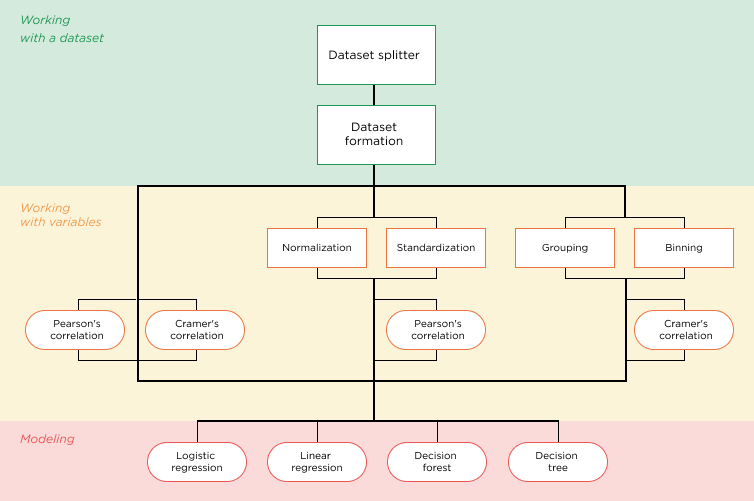
Figure 2: An example of the relationship between the guided stages of the modeling process.
Please note that if the modeling graph is not customized, the count will use the default standard modeling graph provided by the platform.
The graph creation described above is currently in beta testing. For now, you can use the Standard Graph.
The standard graph, provided by the platform, consists of the following functions in sequence:
- Dataset Splitter;
- Variable Grouper;
- Cramer correlation;
- Logistic Regression Modeling Method.
Once the target selection is performed and the modeling graph settings are defined, you can proceed to fine-tuning the individual parameters for each function of each stage of the generated graph.
Customizable functions of the modeling process stages
Modeling Process is the construction of one predictive model for one target with one Set of Settings in the context of one Count. You can launch as many modeling processes as you need, experimenting with:
- Selecting all or some of the targets;
- Adjusting the sequence of functions execution for each stage;
- Limiting the dataset if necessary;
- Choosing all or only the necessary variables;
- Using different settings and sets of modeling stage functions.
The functions of the stages of the modeling process that are subject to user customization include:
1. Working with the dataset: dataset formation, dataset splitter.
Read more via the link.
2. Working with variables: formation of a variable list, processing of variable values, measurement of variable correlation.
Read more via the link.
3. Modeling: choice of modeling method.
Read more via the link.
Modeling
After all the settings are defined, the platform will create a certain number of modeling processes according to the number of selected targets and selected sets of settings. The platform does not use your computational power and performs all the necessary calculations in the cloud.
The amount of time required to perform modeling can vary greatly depending on many factors, such as the size of the variable and target files, complexity of settings, the number of iterations, and selected mathematical algorithms.
Results of counts
After the counts are completed, a list of modeling results will appear, which includes a table with the results for each target and a count parameters panel. The table will display the count and the logging files for each stage of the modeling, which can be downloaded. A progress bar is displayed during the process.
The preparation of the results takes time and is charged separately.